
Role: Product Designer, leading end-to-end design in a focused team and part responsible for a consistent platform with the other designers.
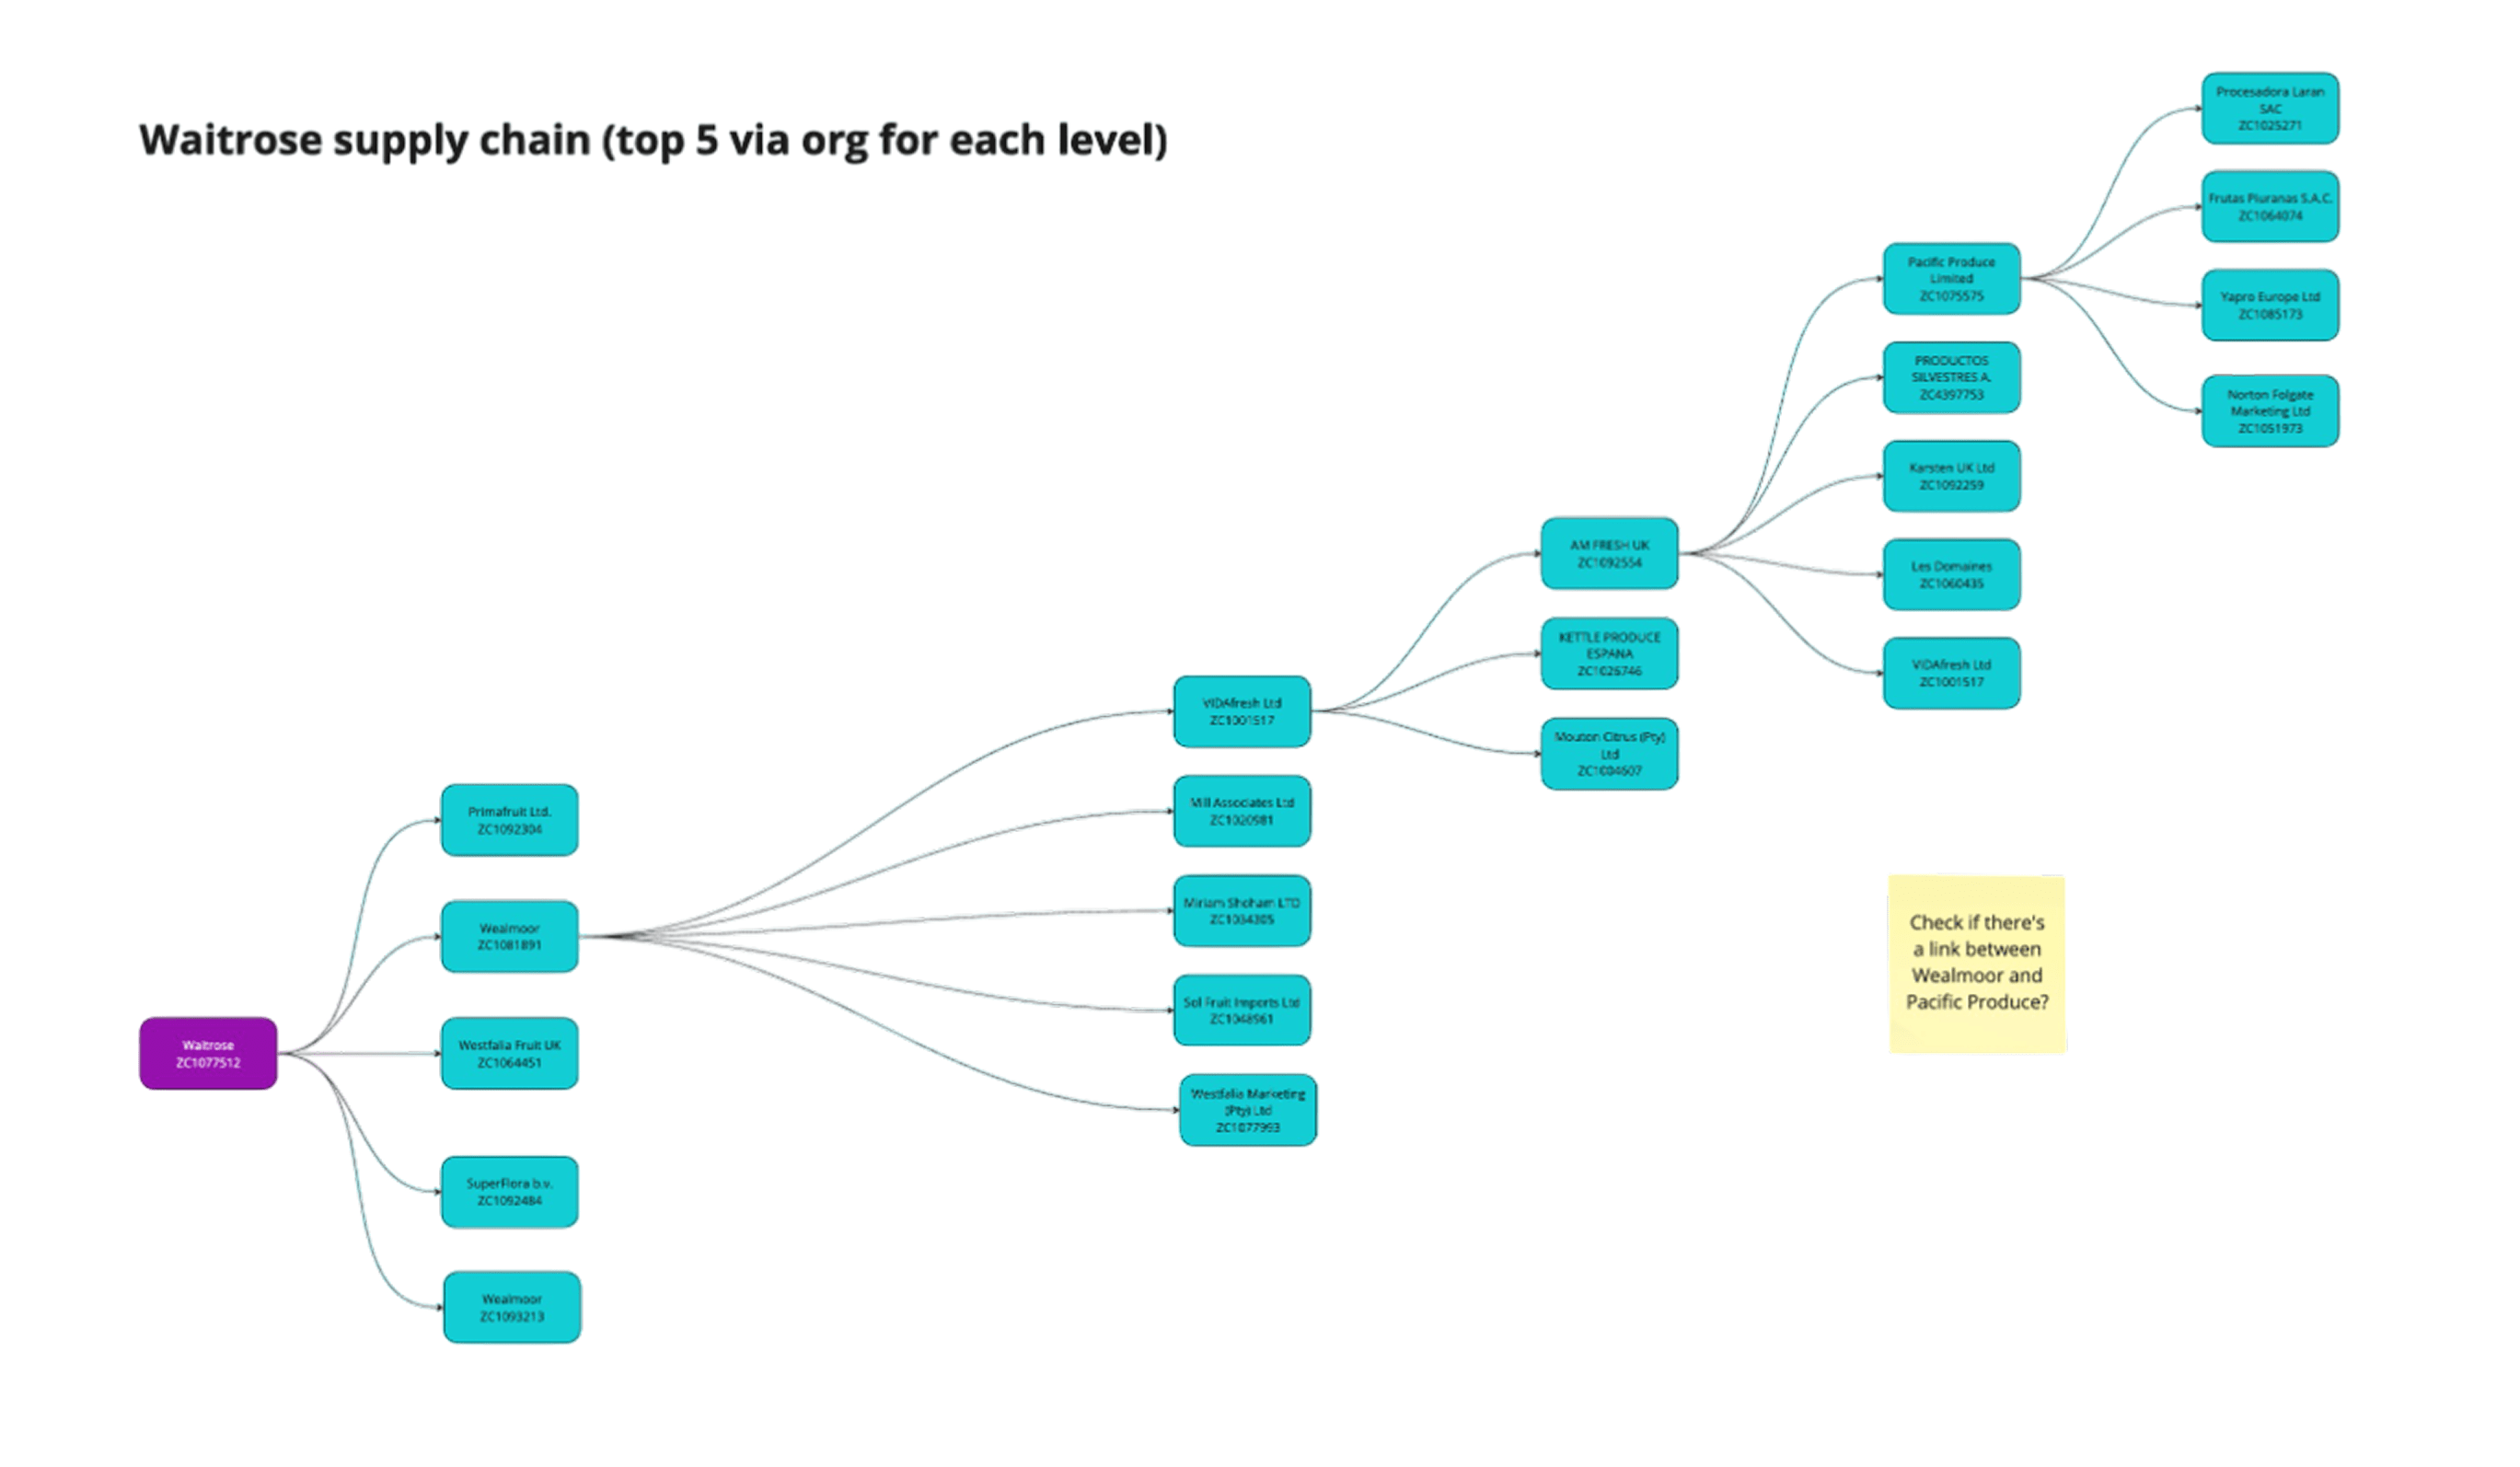
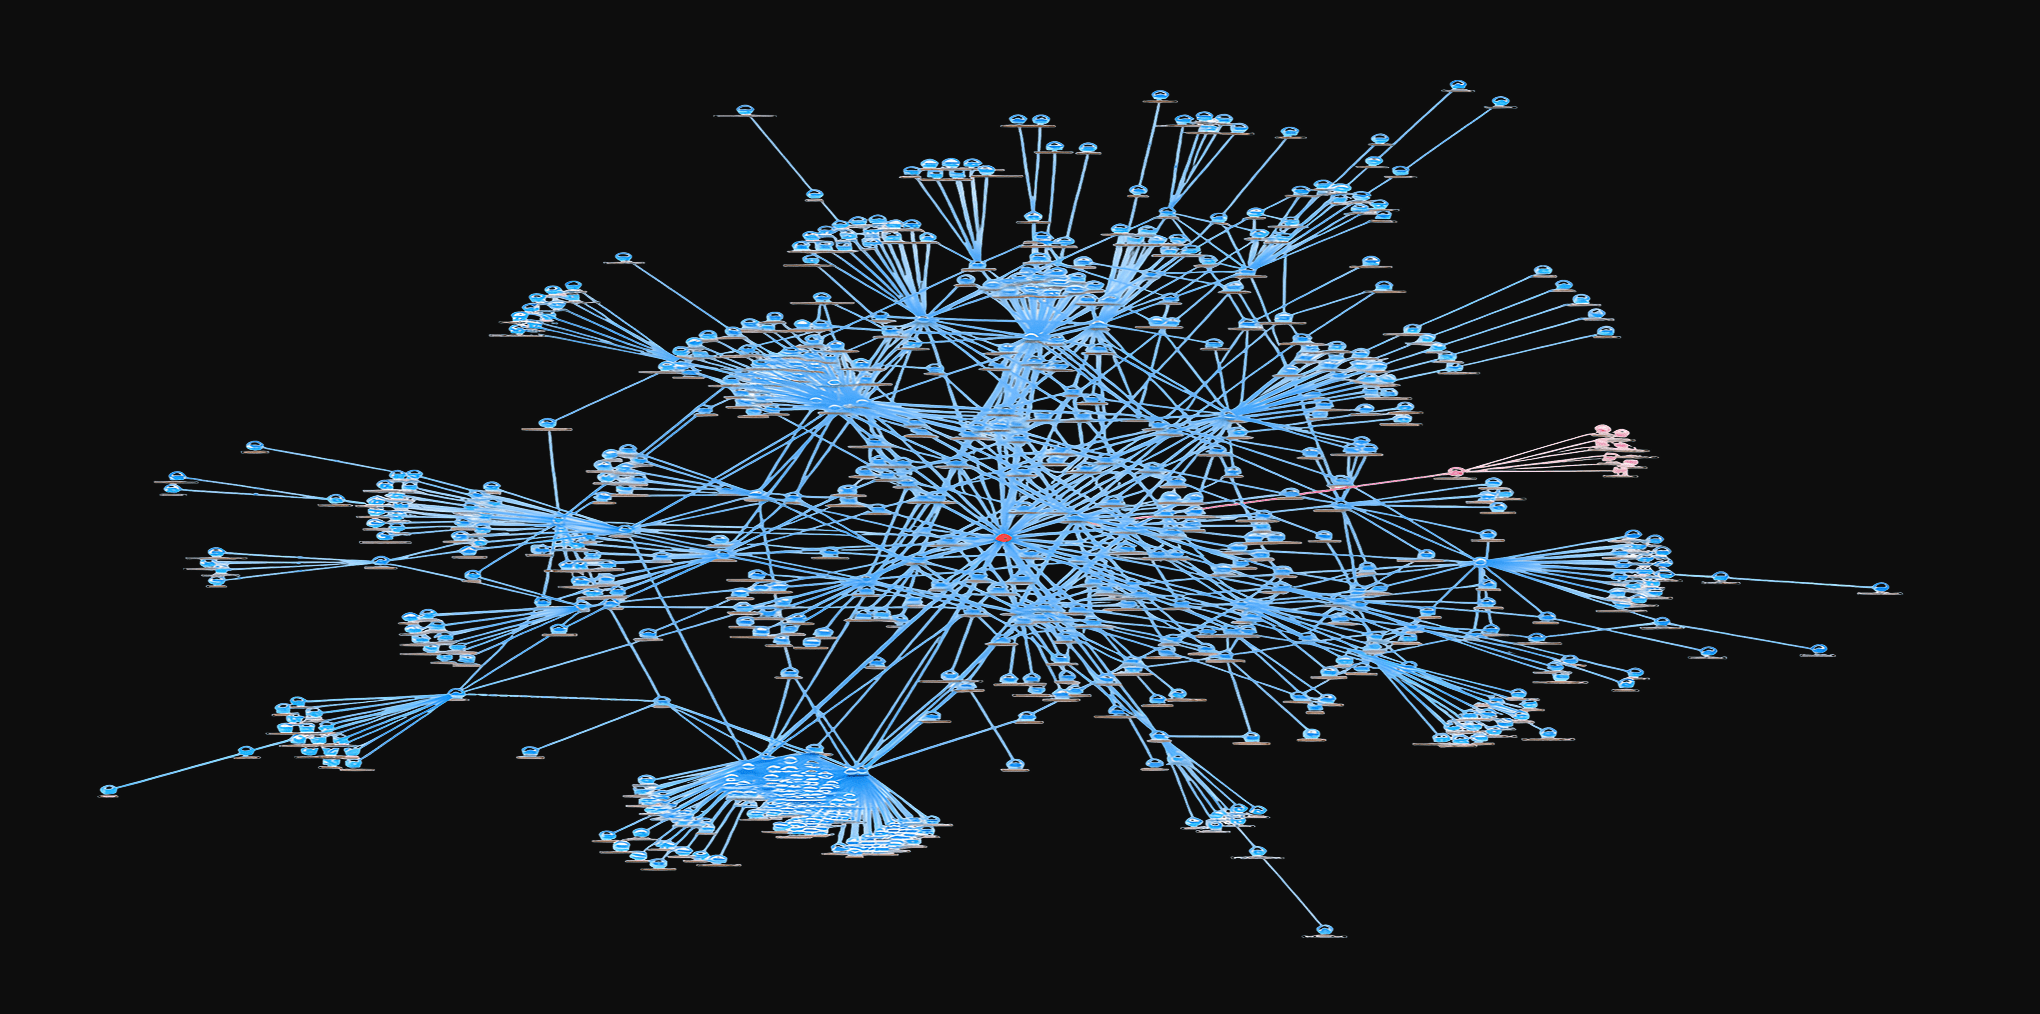
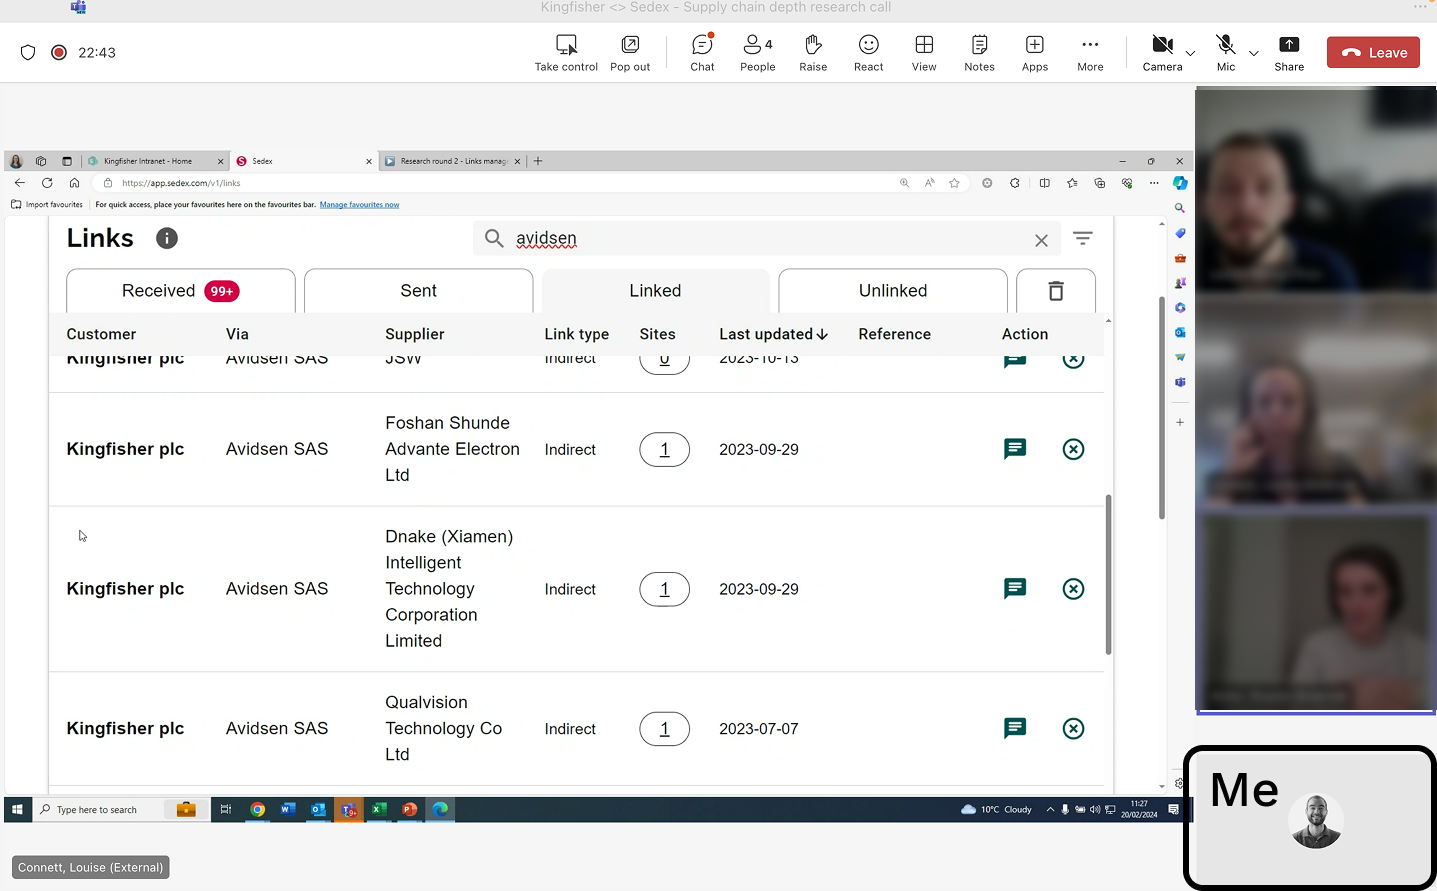
Product team: Linking (Synergy), trading relationships
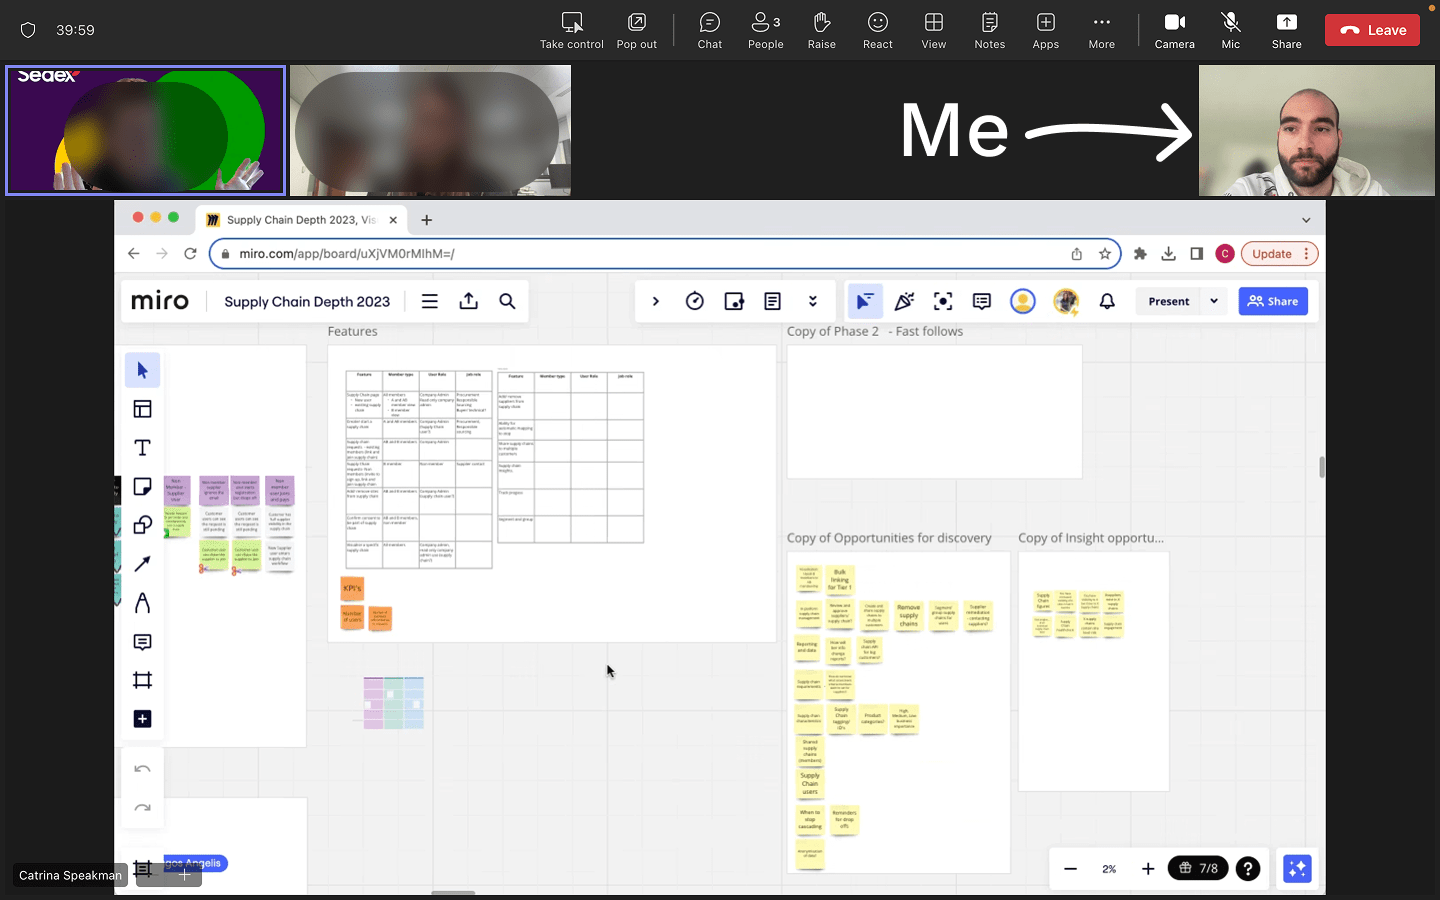
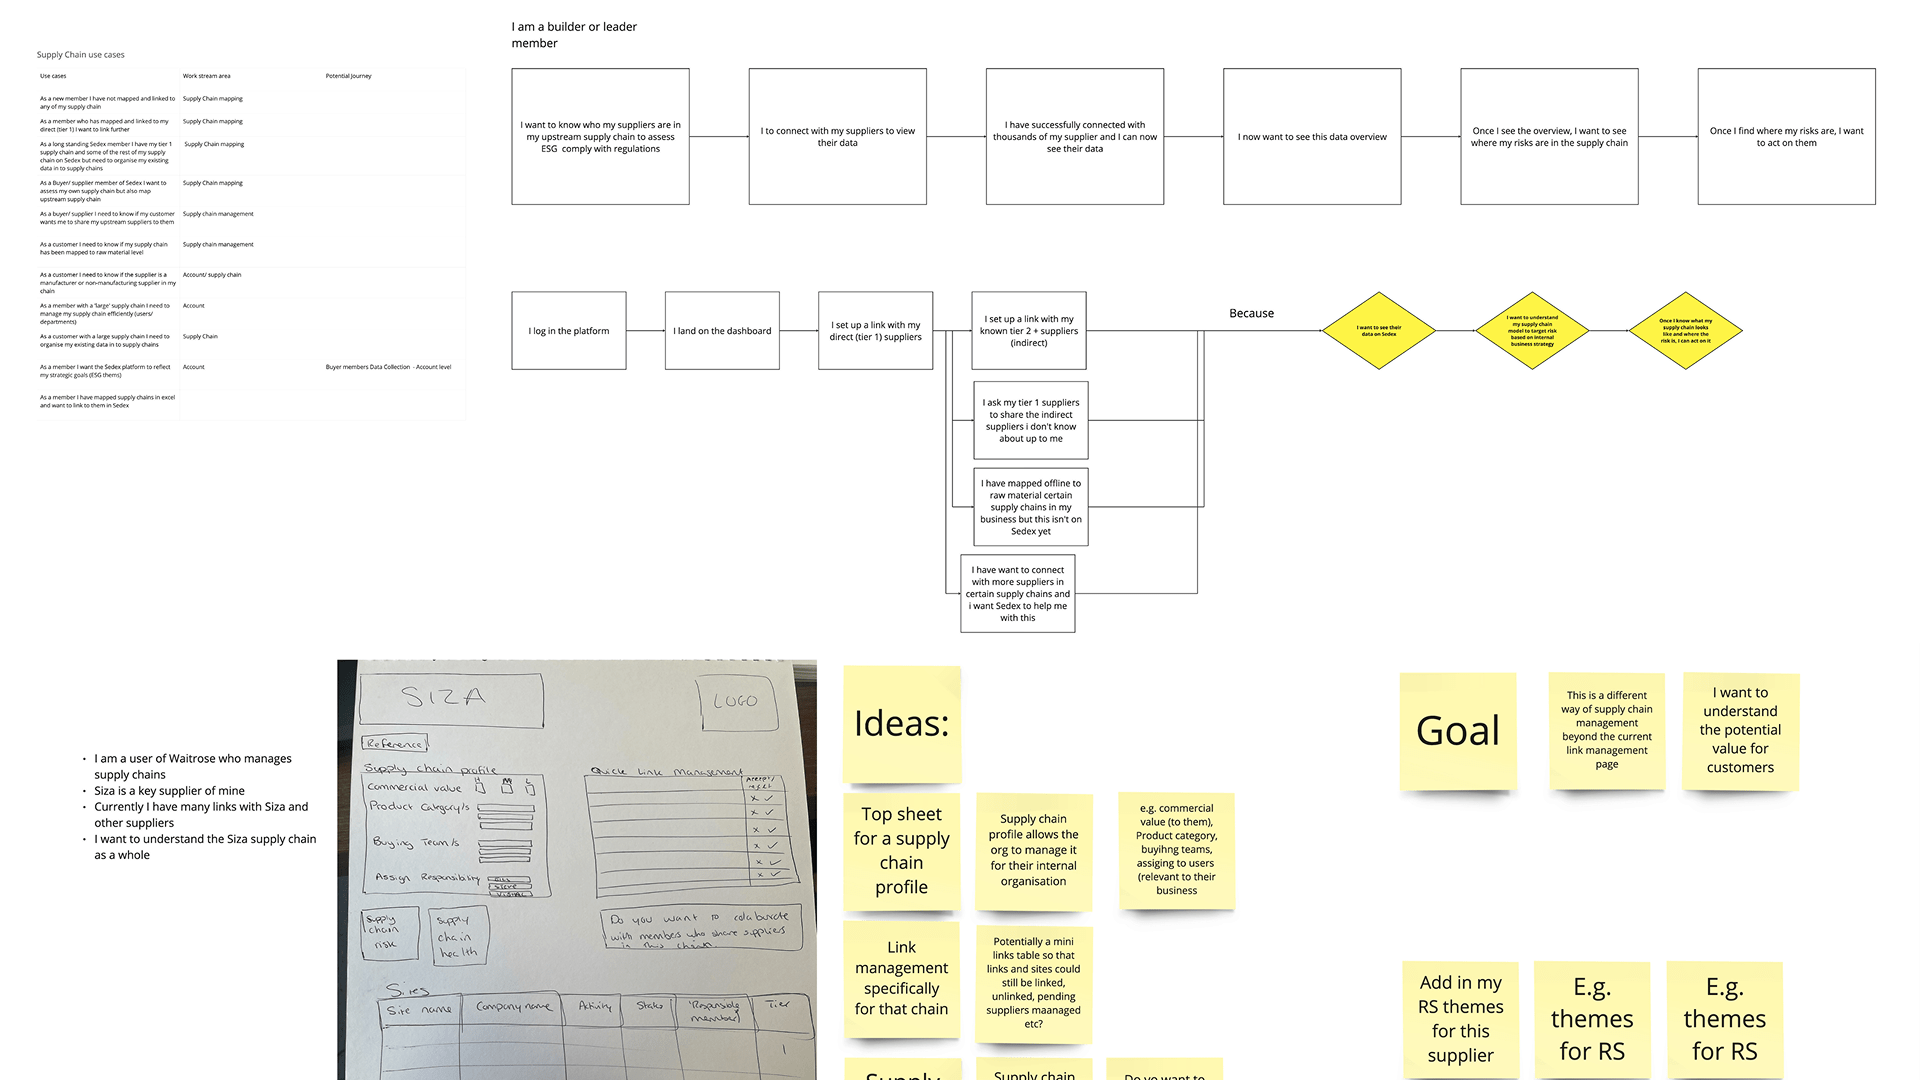
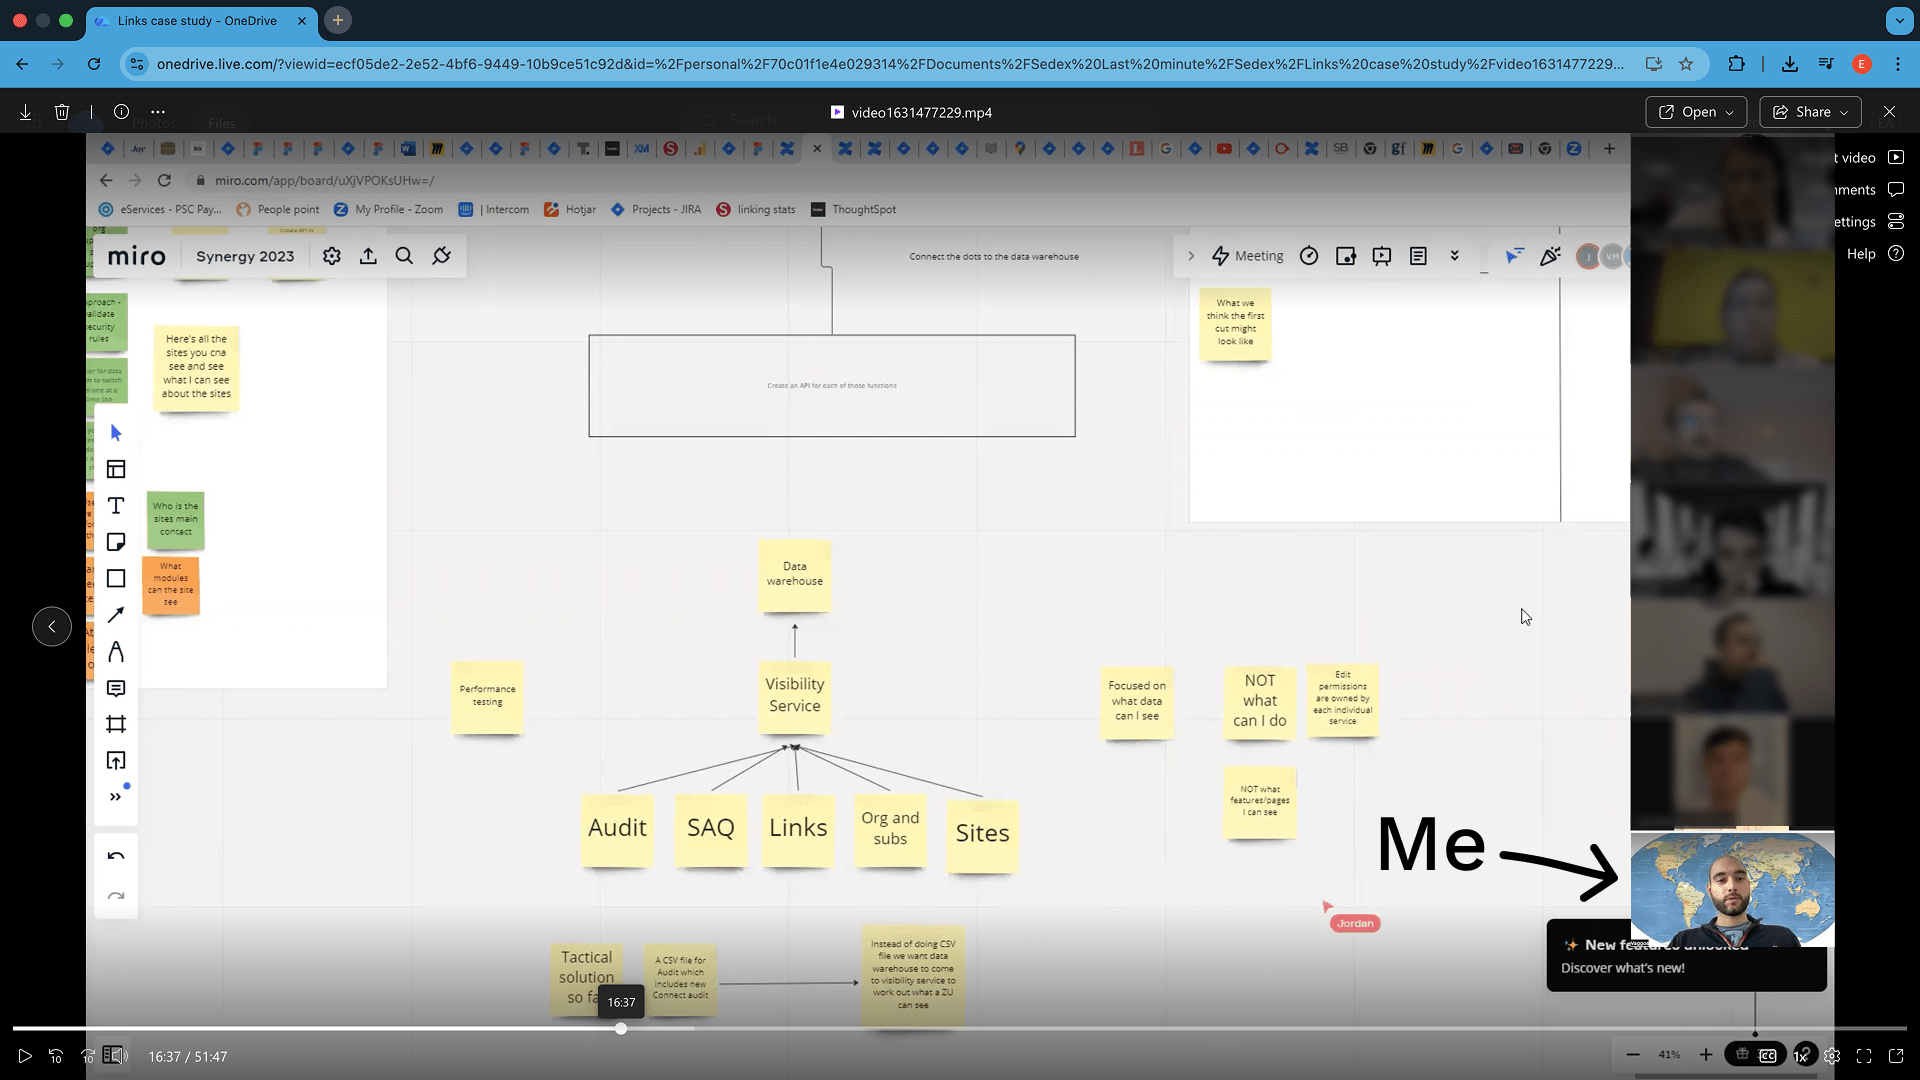
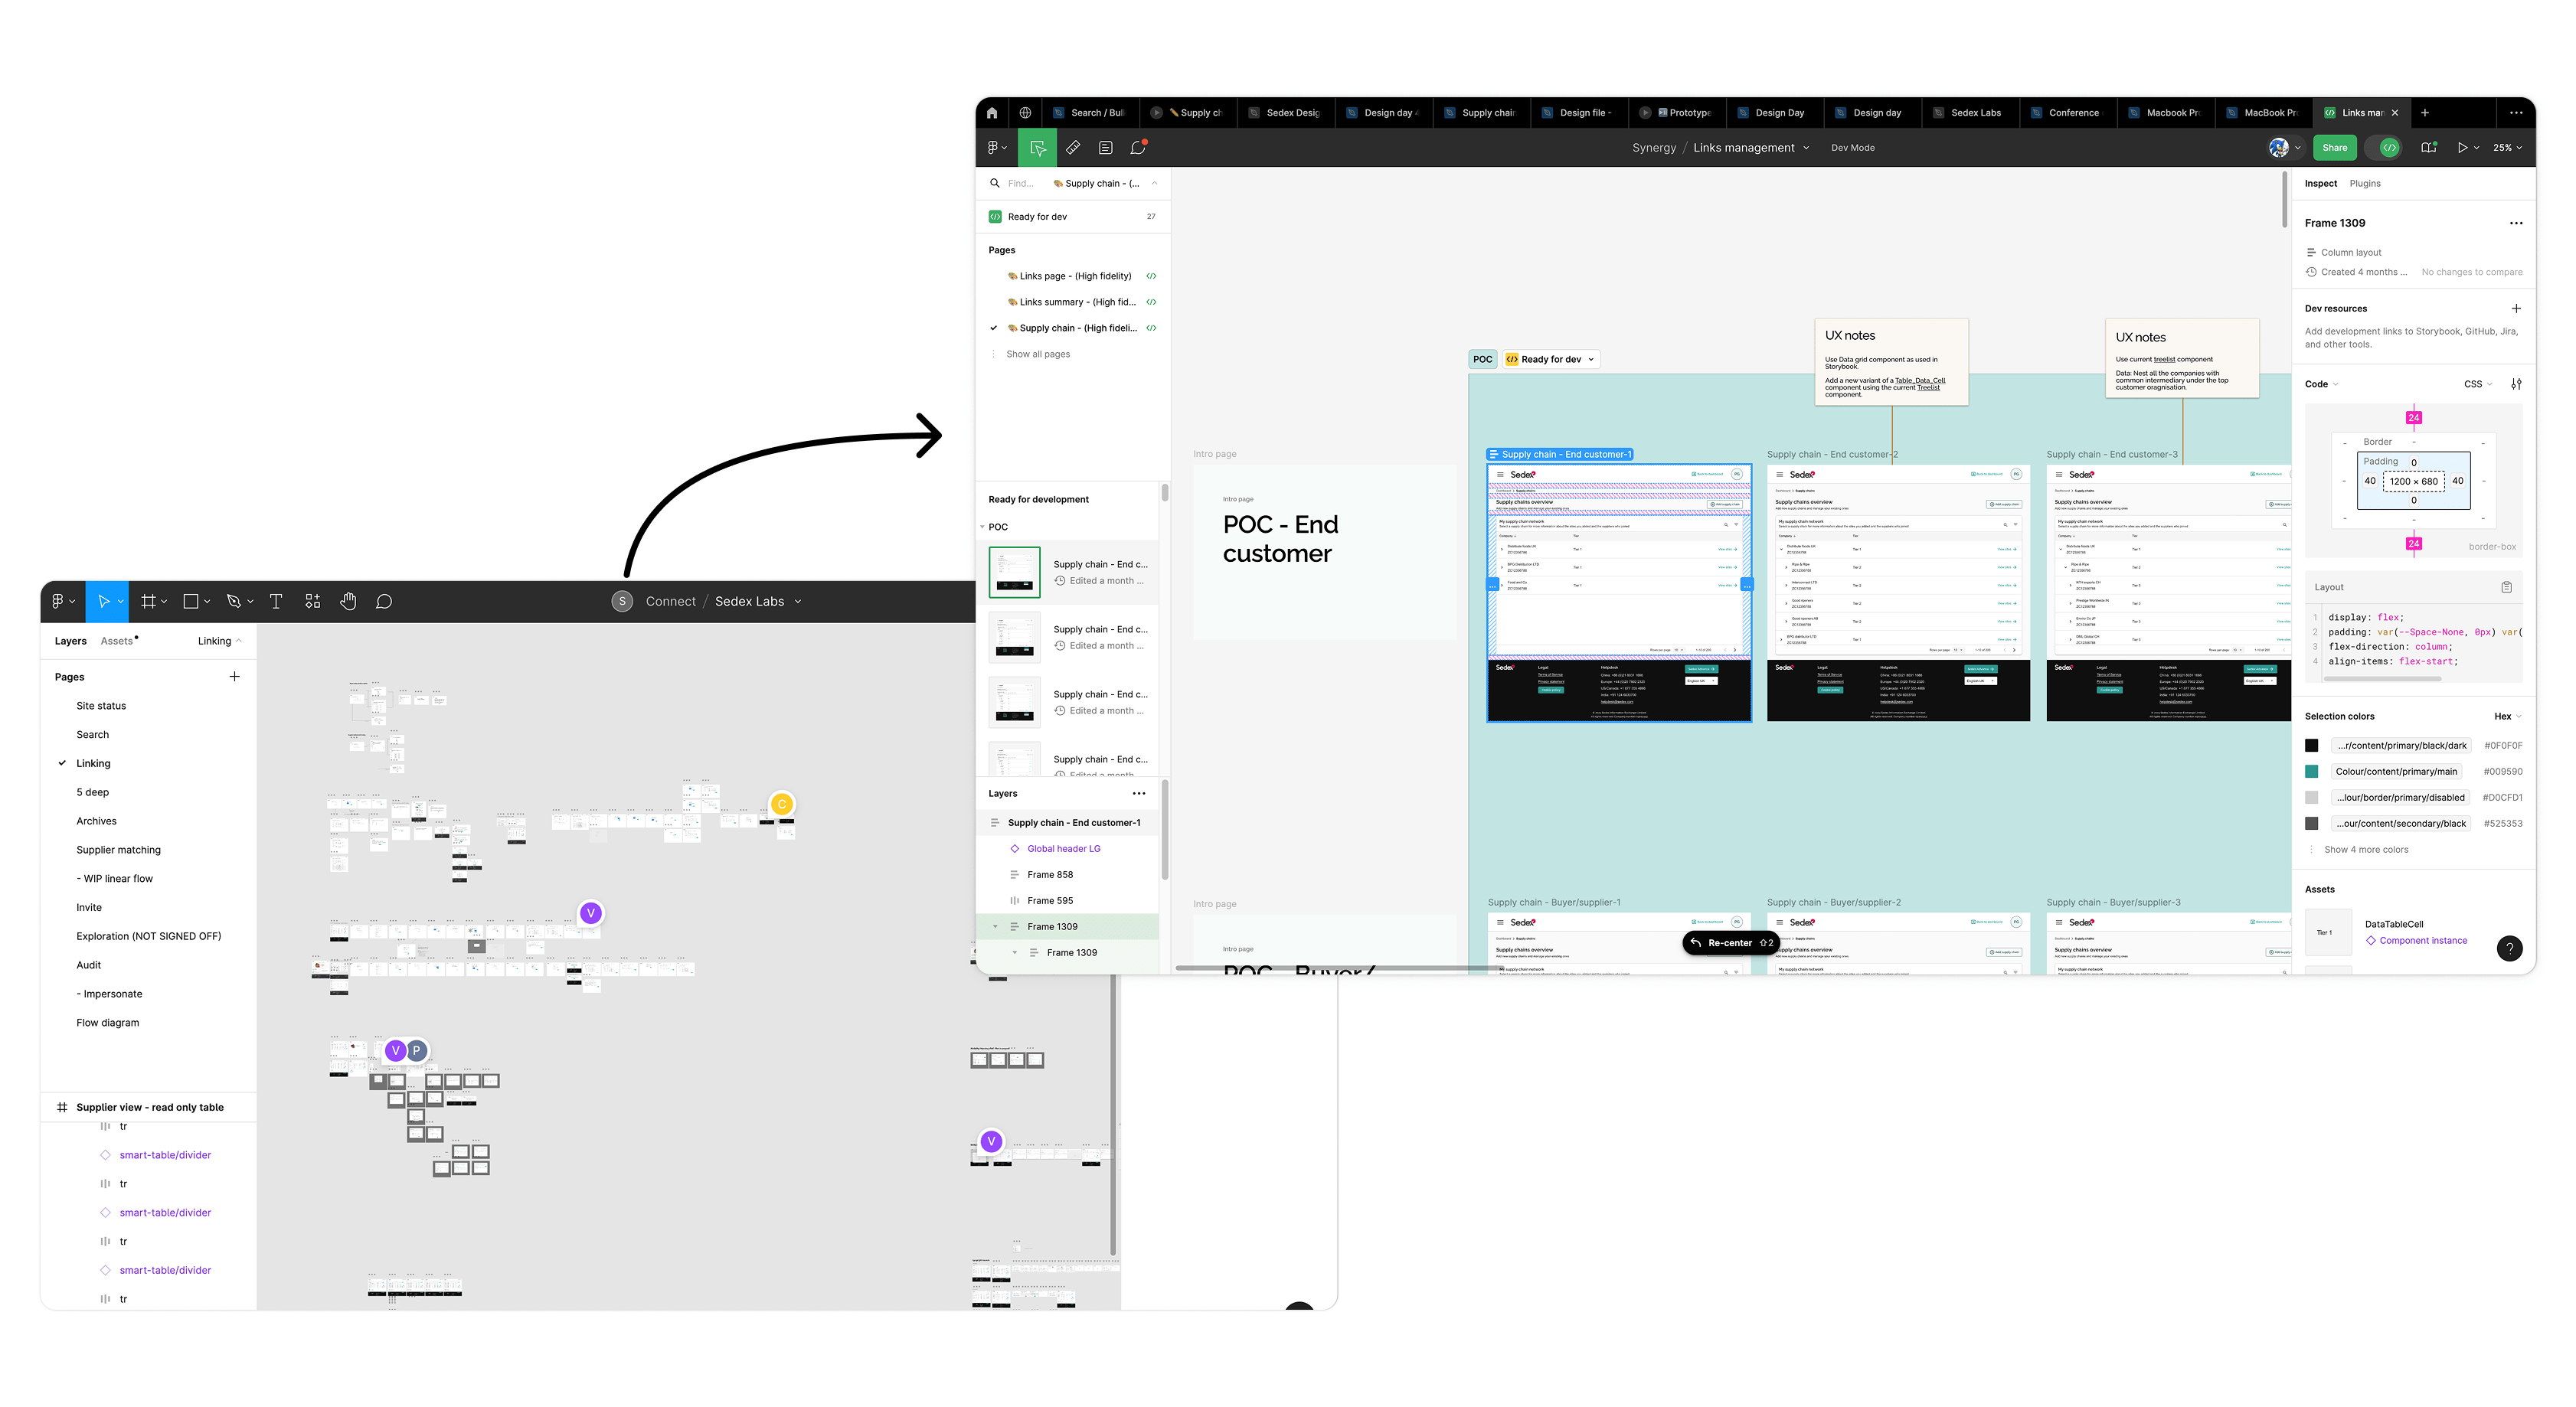
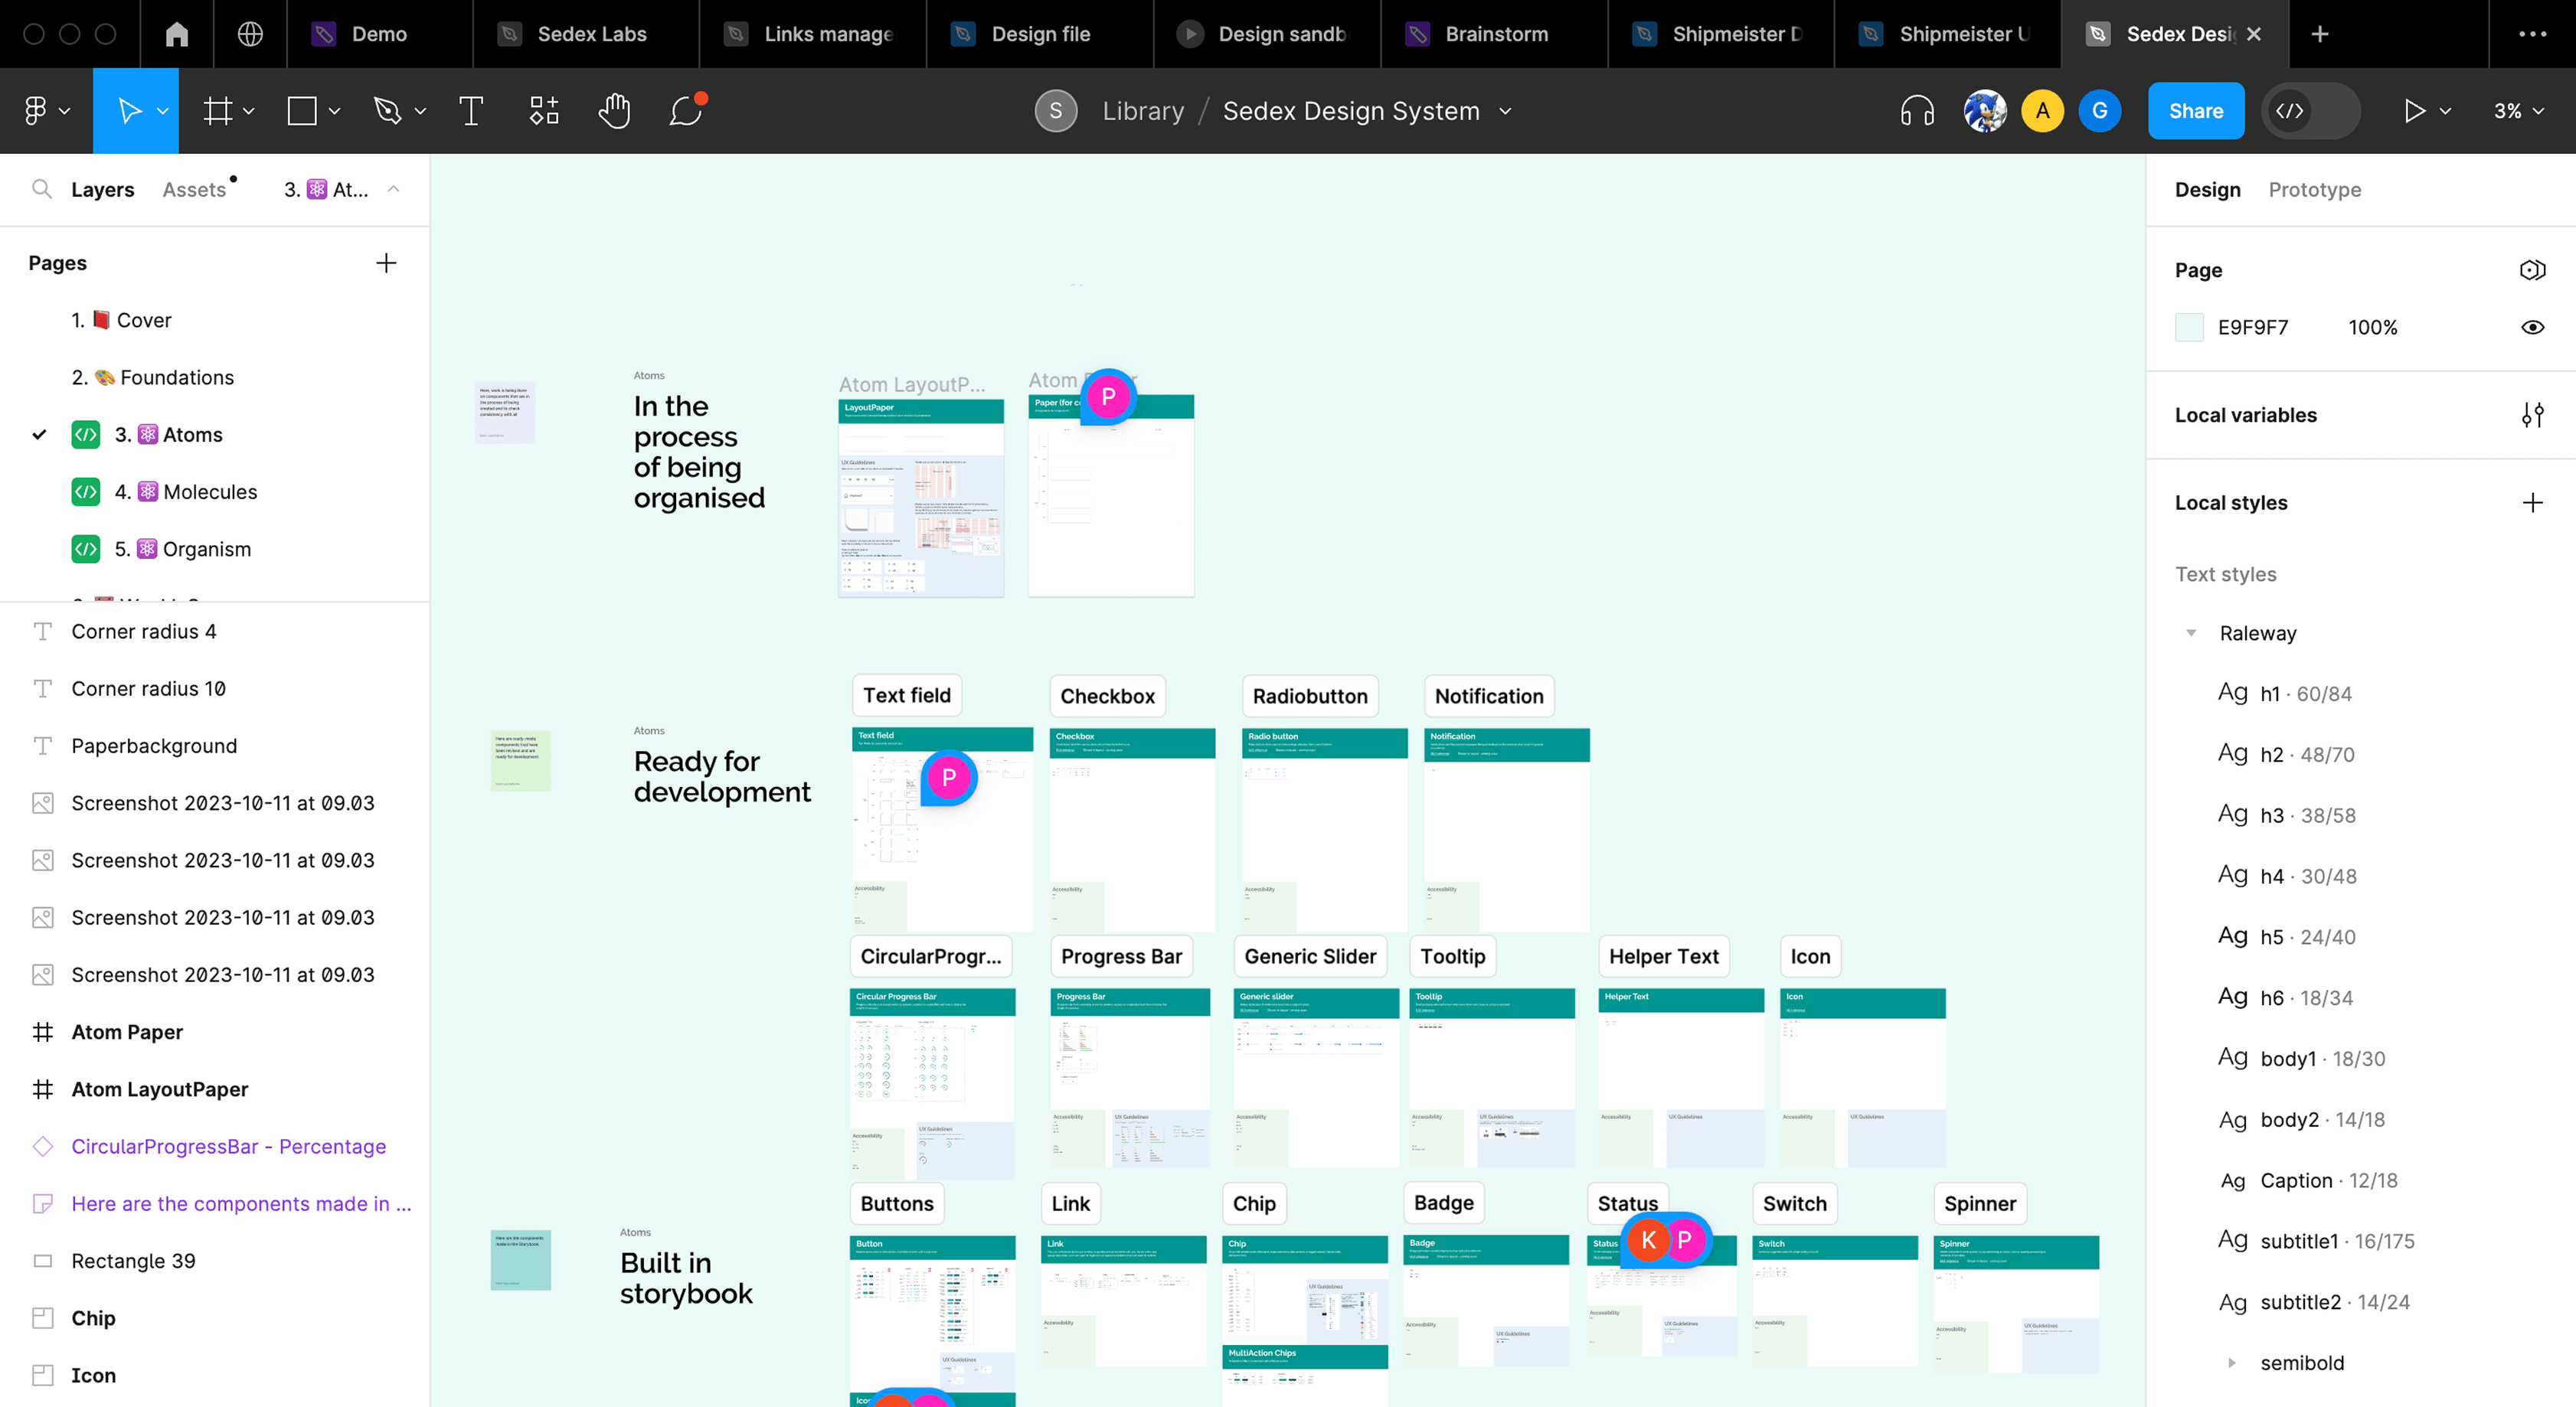
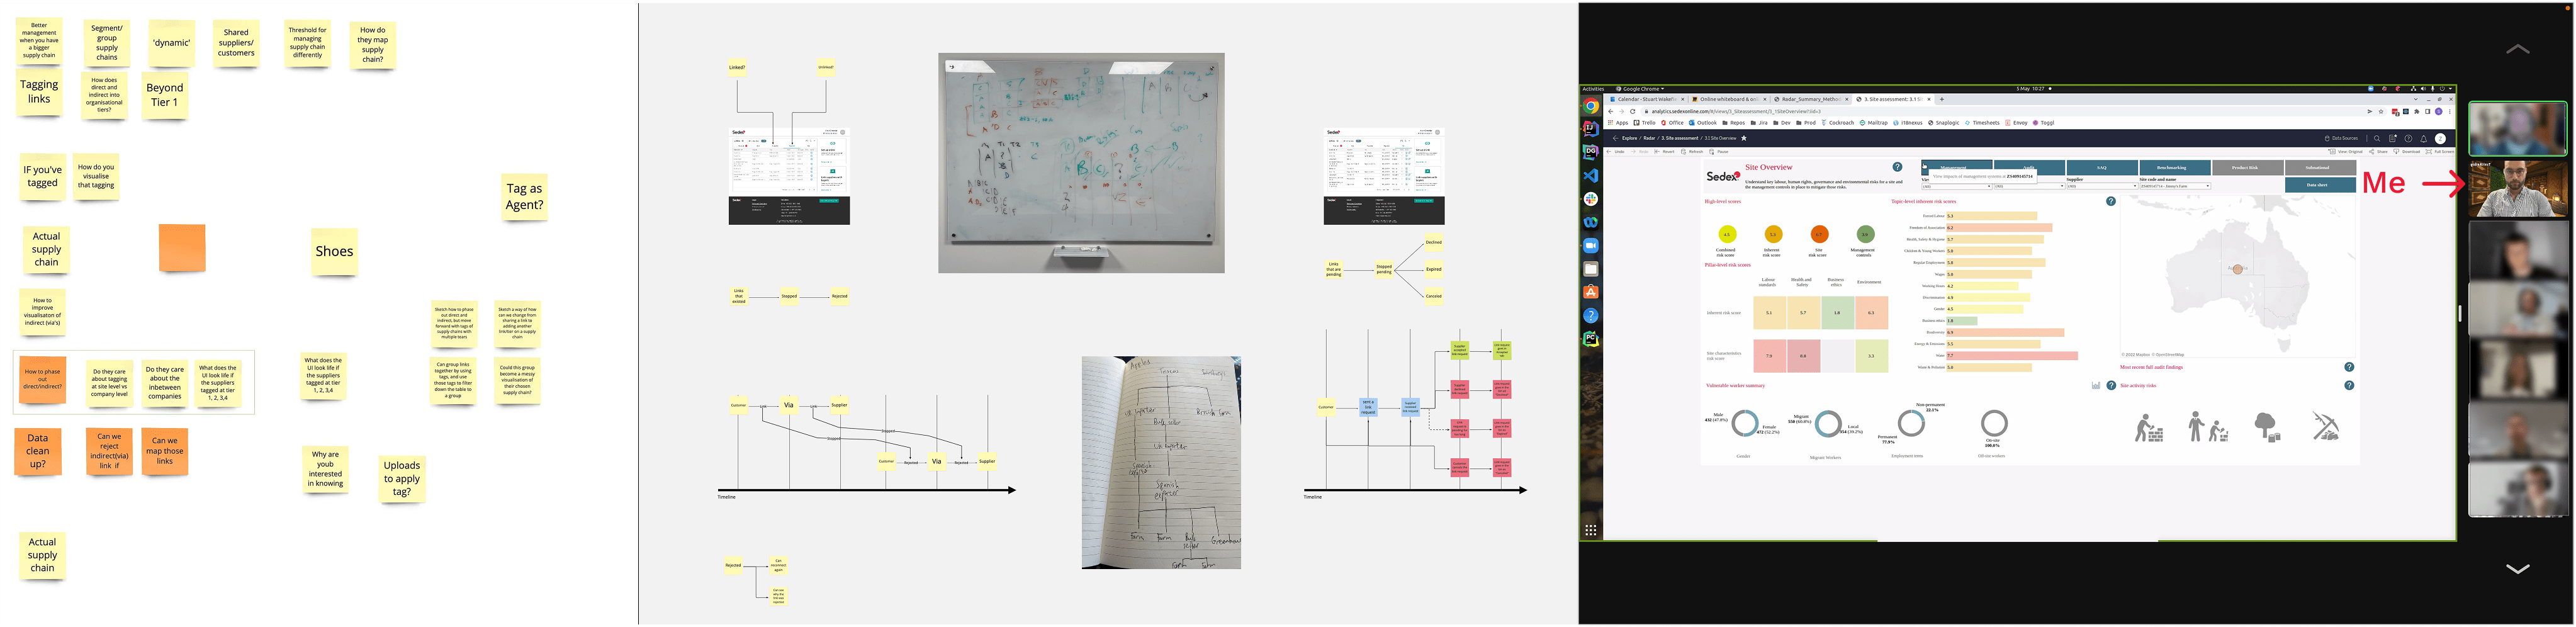
Primary tools: Figma, UserTesting, Dovetail, Miro, Jira, Confluence, Google Analytics.
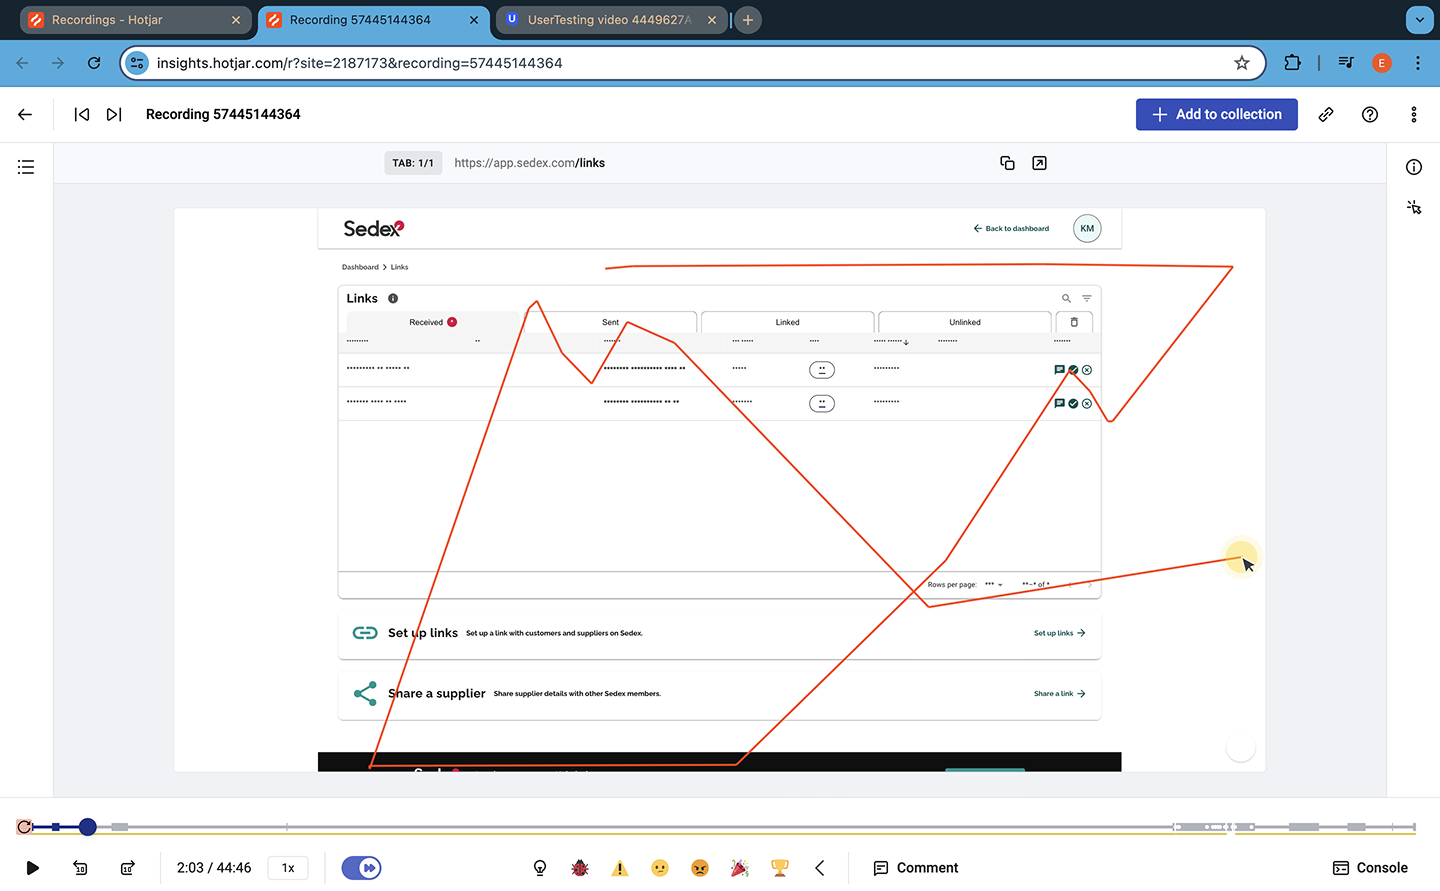
Other tools: Qualtrics, Hotjar, Thoughtspot, Confluence, Intercom.
Timeframe: May 2022 - July 2024
A global leader in supply chain data exchange, empowering businesses to make responsible and ethical decisions by providing transparency into supplier networks.


*Environmental Social and Governance

The platform is old! The data supports a maximum 3 tiers of trading relationships, missing the full transparency of a supply chain, resulting in failure to uncover all ESG risks.

The supplier networks for enterprises as big as our customers can be huge. They branch out in all directions and they also use subsidiaries.

A large community expecting ROI*.
*Return Of Investement
Users of large enterprises have to chase risk data from thousands of suppliers.
Members must navigate hudreds of sites to uncover risks in large supply chains.
Sedex grows with more than a thousand new members every month.
"Can supply chains be fully transparent and still be easy to navigate so that our users can manage their risks efficiently?"
The problem was first highlighted to our customer support department, with the majority of our major customers complaining about the supplier network transparency on our platform.
Intercom survey: How can the platform help you more?
Total number of votes: 634
*Self Assessment Questionnaire
I joined calls with our existing customers and ran research workshops as soon as possible to hear the problems from the users and understand their needs.

After talking to users, I decided to map out the relationship management journeys for the two different user types. I documented every journey on Miro so that I could study them with my team.
After I did the journey mapping for the different user types together, I understood that the end-to-end journeys don't only have Sedex platform touchpoints, but also user-to-user in-platform interactions.
-min.jpg)
After running workshops with executive members and stakeholders, the company expected that by expanding the supply chain visibility, we would uncover suppliers that are not Sedex members which was a key opportunity for membership growth.

Myself, a Product Designer, collaborating in a team which included a Product Manager, a Tech Lead and 8-10 more developers got together to share our first thoughts.

Due to the large size estimation of back-end tickets, I had time to drive immediate changes in the UI.
Together with the other designers, we worked on a new clean style for the new platform, which helped me solve my team's important usability problems in collaboration with the front-end developers.

With new changes in the UI and Figma software updates, as a design team, we took the chance to do some housekeeping and update our documentation.
No legacy components in Storybook.
Figma design files.
More front-end tickets in Jira per sprint.
Updating the UI became efficient and scalable.
It was very crucial for me to drive changes in the interface and the experience without interrupting the workdays of our existing userbase, while also introducing experiences that new members would find easy to learn.

Together with the Product Analyst we set up events tracking on GA, and discovered that users like to use the search function.

I set up Hotjar and saw that the nudge drives users exactly where they need to be, and the new table makes it faster for them to scan information.
Thoughspot showed unhealthy data.
Our data fetching services are slow.
We still don't support more than 3 tiers.
"If we use an AI that targets duplicate links and users are nudged to double check them, users will clean up unhealthy data."
"If users have a clean UI that also loads fast, they are less likely to create the same links more than once."
After the back-end developers had been working on the data restructure and building new services, I understood that we could build a front-end service that complimented the data repositories by using a few different concepts to surface the data in the UI. The new services would work faster and capture data discrepancies.

Users should find their supply chain quickly. On the page they can either be notified to action urgent matters, or drill down their supply chain tiers and find sites that they want learn about.

Even though all designers agreed that the platform would benefit from a notifications centre and we would all contribute to design it, all developers advised that not all teams have the infrastructure for it so it would take a long time to build. The Product Managers had prioritised other work streams and this would be revisited at a later point.
We want users to be able to visualise their entire supplier network in a true hierarchical format, in order to help them effortlessly trace products that they buy, back to their raw materials.
-min.png)
We can either keep our dataset-style table and use tags to show tier depth and help users through, or we can use a form of a hierarchical visual that shows tier depth and product timeline traceability.

I prototyped three of the major ideas that we had and conducted various experiments. From testing them with users face-to-face in conferences, to running testing workshops, and unmoderated experimentation on Usertesting.

The voting preference was tied between two concepts, confirming what I had anticipated.
Supply chain top sheet is good for looking at sites, but not for the whole supply chain.
Tree view is a great concept but what would it look like with thousands of suppliers?
A linear view is clean and not overwhelming but it doesn't show the full scale.
Total number of votes: 80
Supplier networks are needed for users to visualise the full scale of their trade, supply chains are helpful to group sections of the trade, and pathways represent the linear timelines of the products.
Can we use a combination of concepts to compliments eachother?

"If users can switch between the supplier network to the pathway they can visualise their supply chain both in bulk and in detail."
We decided to build a proof of concept in order to understand what our expected loading speed would be with the data APIs.
To save time from building the Proof Of Concept, we decided to use MUI components, so used the data-tree component. The data-tree would show how data renders when users expand a the componet inside a data grid.
.gif)
Since we already had a stepper component in our design system, and the page caching was in place from the last updates, I decided that we would benefit from testing the transport-map-style concept.
So with the confirmation from the developers that it would take less than a spring to build, we made a POC and tested the tube* map style together.
.gif)
*Tube is the London underground railway.
By bringing in components from MUI, we didn't only save development time, but we were also more confident about the accessibility of the new features.
The confirmation of the hypothesis, and the confidence in our data performance, gave me the green light to finalise the concept. So the last step was to finalise the usability. I produced concepts in all fidelities, combining both features and a nudge to drive users attention to updates and urgent matters.

A user lands in their supply chain page where they can visualise their entire supplier network represented in a data-table with a tree list, representing the hierarchy of the supply chain trading relationships and keeping things tidy. From that page, the user can collapse the nested companies to reach as many tiers as they need to find the company they want to, click on more, and visit the company's sites page.
On the sites page, the user can consume any site related data, with the ability to switch between tiers tracing all sites related to a products' pathway.
These are the goals that we wanted to achieve set by the business.
We achieved our transparency goals.
We uncovered "non-assessed" suppliers.
(New members)
These are the impact measures that I set myself to understand the users' experiences hoping to help our users with their ROI, and to contribute even more towards Sedex's success.
Used GA events to track this.
Thoughtspot showed less duplicate links.
From comparative analytics on Salesforce.
From Tablue and Intercom survays.
©Evangelos Angelis ️