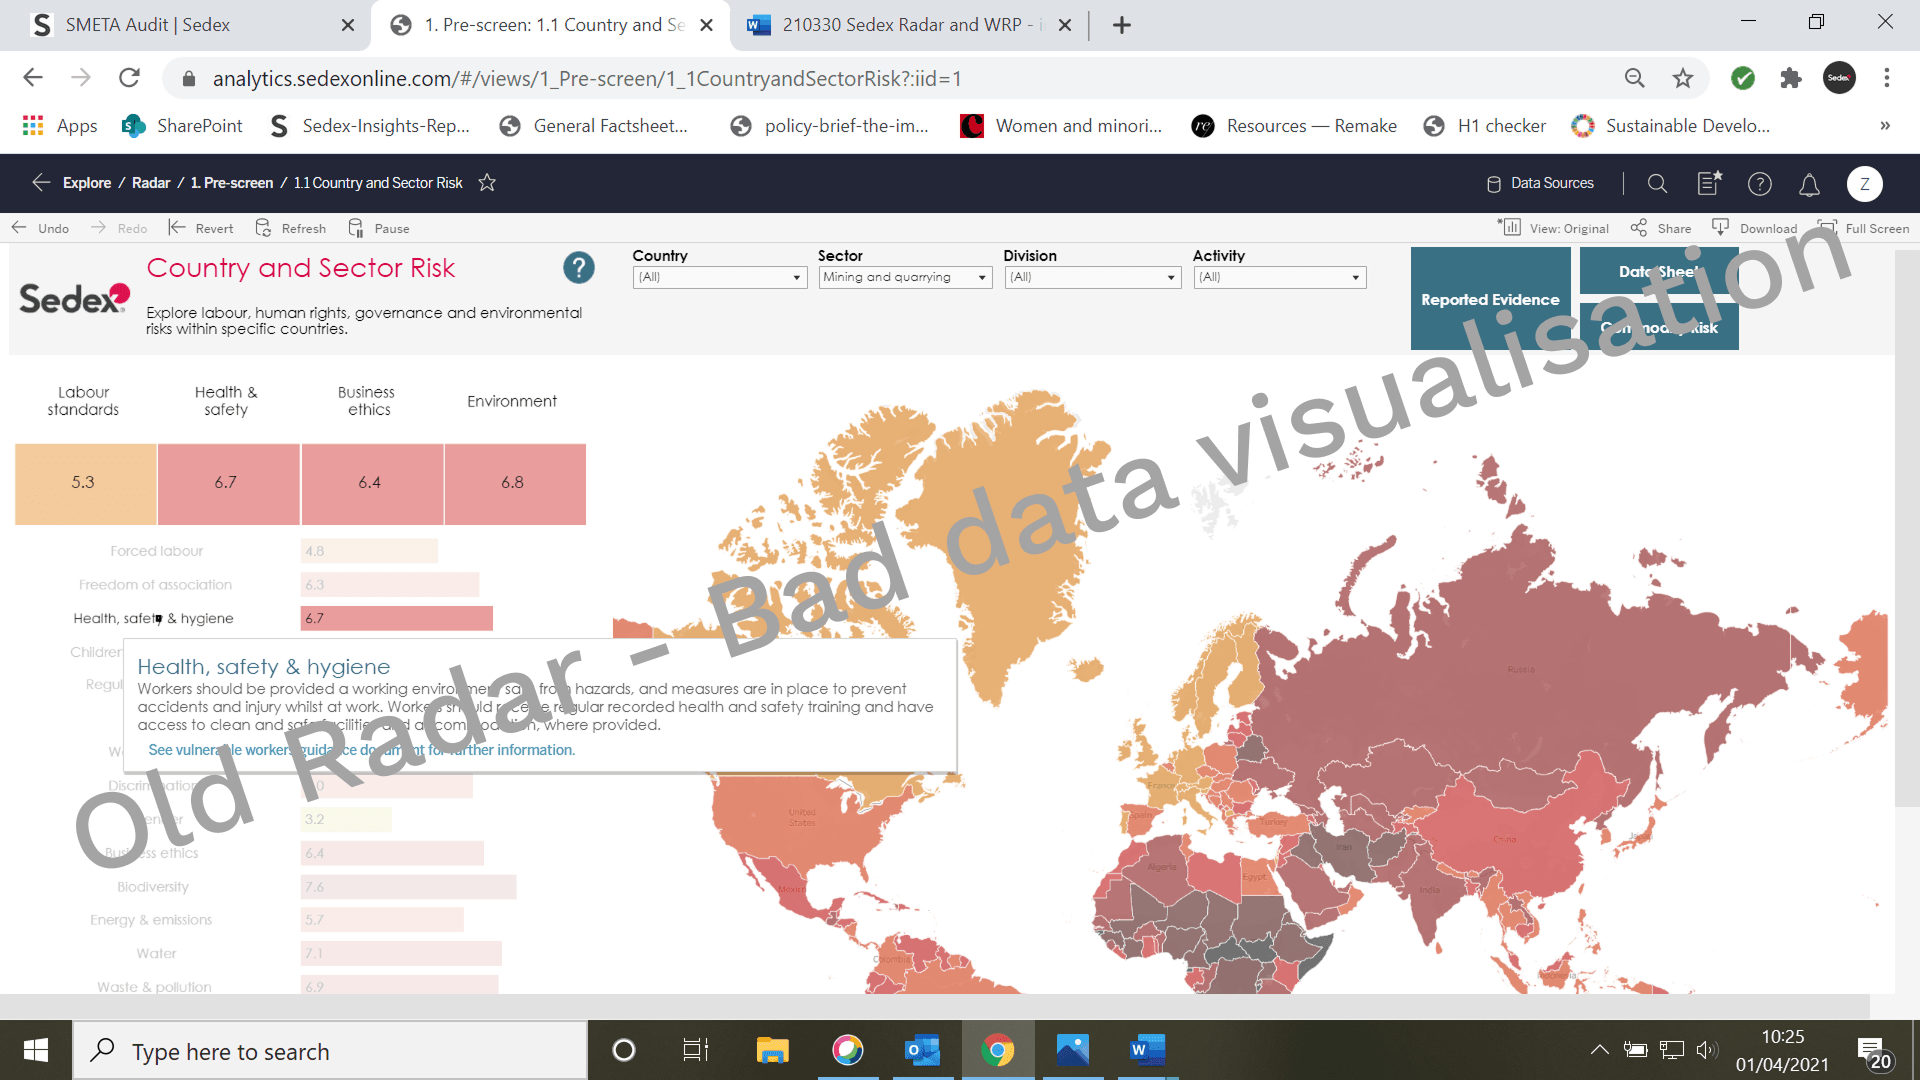
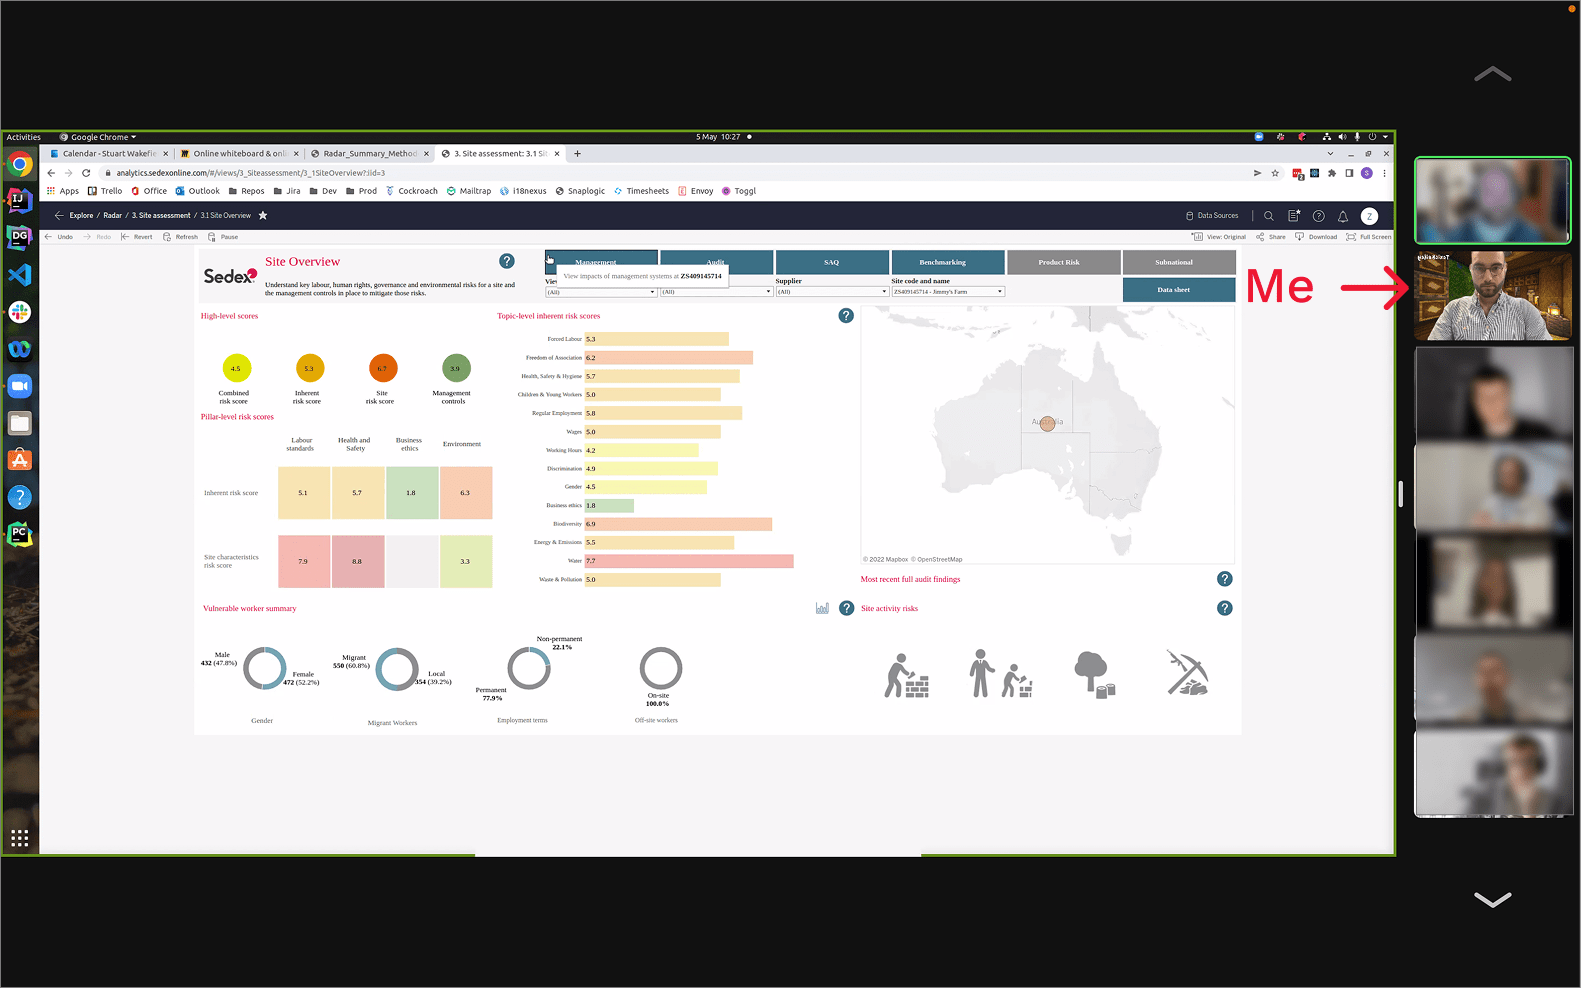
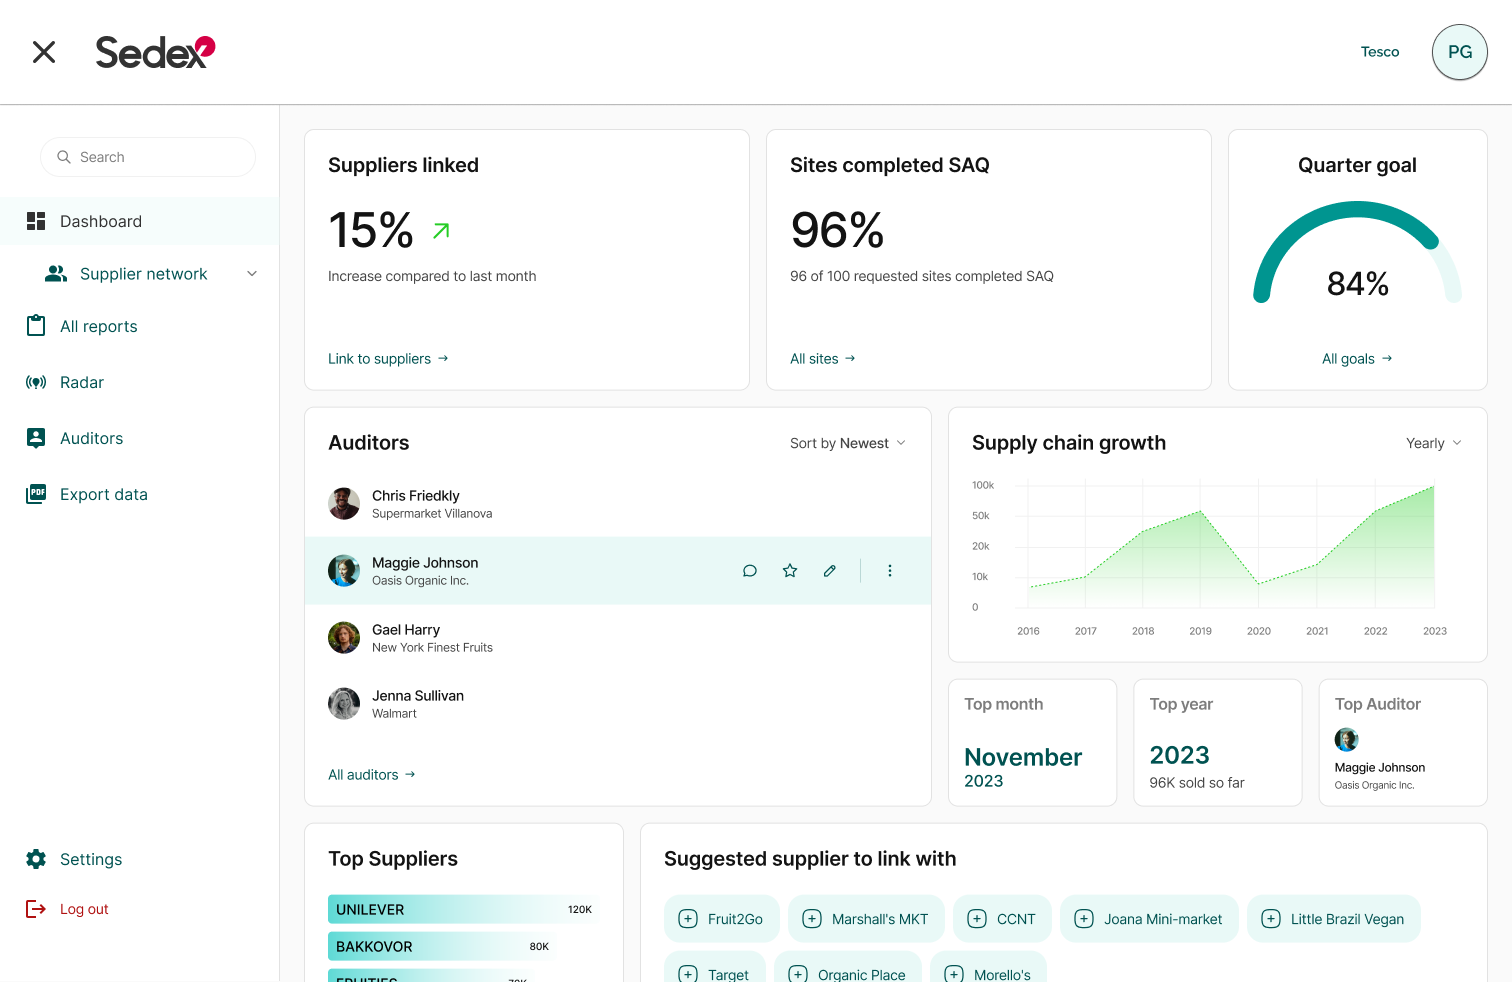
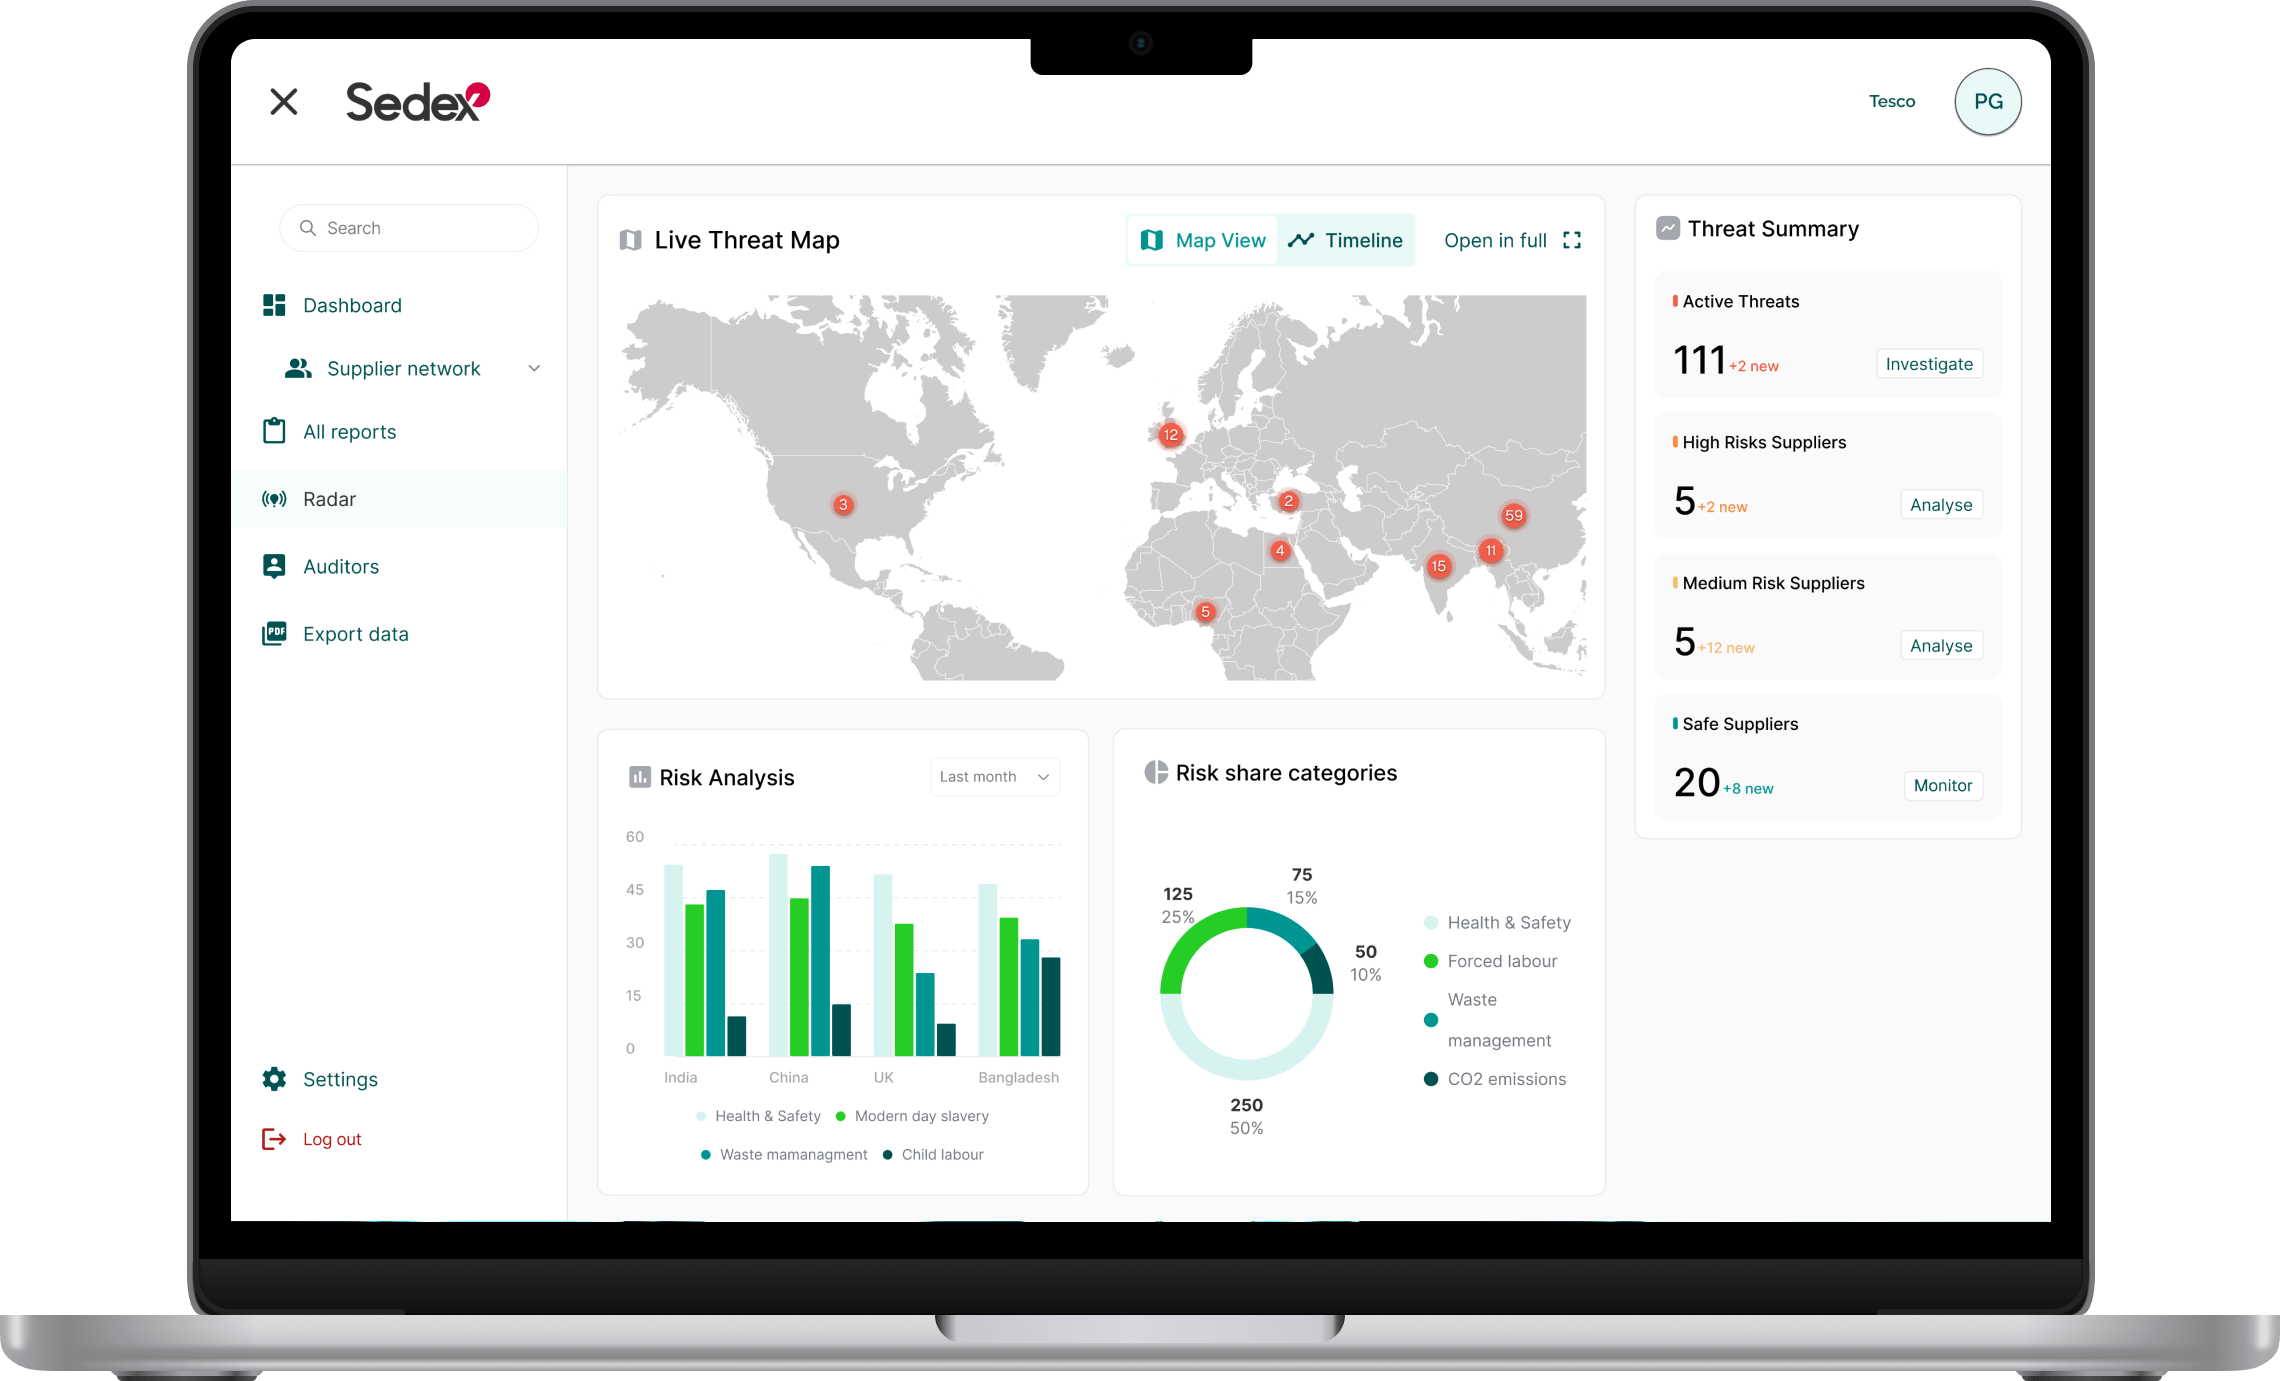
Role: Product Designer, leading end-to-end design in a focused team, co-owning platform consistency with the design team, and shaping product goals, scope, and success measures with the team.
Team: Small initiative of myself, a Tech Lead, a Solutions Architect and a Front-End developer.
Primary tools: Figma, UserTesting, Dovetail, Miro, Jira, Confluence, Google Analytics.
Other tools: Qualtrics, Hotjar, Thoughtspot, Confluence, Intercom.
Timeframe: April 2024 - September 2024
A global leader in supply chain data exchange, empowering businesses to make responsible and ethical decisions by providing transparency into supplier networks.


*Environmental Social and Governance

Our old tool called Radar produced inherent risk analysis for companies serving as a predictive tool to help large organisations prioritise who to assess. Radar lived in a separate platform and it's design language was completely different to all other Sedex's toolkit.

As we are upgrading the platform's design language, we need to also update the dashboard. Due to the different widgets that would go on the dashboard, all designers needed to come together and design widgets according to their background knowledge from their focused teams. Can we also incorporate Radar in the new dashboard?

Because I was the designer on the supply-chain project, I took the initiative to bring Radar in as a separate effort. I designed the hierarchical visualisation of trade relationships first, and Radar’s prioritisation patterns, and users' map interactions would inform if a future map based supply-chain view could work.
The problem was first highlighted to our customer support department, with the majority of our major customers complaining about the supplier network transparency on our platform.

I joined a big workshop together with both our field experts and the developers that built the old Radar to understand how it works.
The platform uses an engine that understands patterns from the risks uncovered by Sedex's assessment tools and it generates risk prediction, known as inherent risk in the industry.

This question was important so we could determine if we would shut this tool down, leave it as it is, or bring it in the new dashboard.
After looking at the numbers, we decided that it was worth putting a small team including myself, a Tech Lead, a Solutions Architect and a Front-End developer to connect Radar with the new Dashboard.
This number was recorded in one week.
This number tells us that the users go back to use this tool.
The majority of users trust Radar, but not enough to be fully confident.
At this stage, I conducted several user research sessions. Customers said they use Radar to prioritise assessment requests, but I observed significant usability issues. Further analysis showed that interpreting the data was time-consuming and hard to grasp quickly.
Radar began as an internal tool for Sedex’s ESG consulting team and was later released to customers as a standalone product alongside the main platform. It’s used by Ethical Trade Coordinators, Health & Safety officers, and similar roles at companies such as Tesco, M&S, Walmart, and Unilever. In Product, we defined a vision to bring a Radar interface and experience into the new dashboard.

Image generated with ChatGPT.
I produced a flowchart to clarify the hierarchical site structure and define the features for the new Radar.

We introduced a bi-weekly Design Day, where the design team co-created the new dashboard. With clear ownership of different tools, each designer defined the widgets linked to their area.

Using an AI assistant linked to my AI notetaker, I distilled my research and created initial design concepts for Radar on the new dashboard.

Images generated with ChatGPT.
I after testing some wireframes in mid-fidelity, I decided to protype the fin high-fidelity and test to validate what might be the final concept.
Radar helps enterprise Trade Coordinators prioritise which suppliers to assess first. When suppliers register their sites on Sedex, they inherit baseline risk informed by assessments of similar suppliers. Sedex’s AI then analyses assessment data and predicts which suppliers most require attention, giving coordinators a clear, actionable view.
These are the goals that we set between the small Radar team and the Design team.
More customers started using Radar as it was now integrated in the same platform.
Risks are identified sooner for quicker follow-up.
Flag-to-start delay: 36h → 26h; ≤7 days:68% → 85%
More assessments surface genuine issues.
©Evangelos Angelis ️